As a new investor, learning to read stock charts is an essential skill that can help you make more informed decisions. Let’s explore the fundamental concepts of stock charts and how they can aid your investment strategy.
What is a Stock Chart?
A stock chart is a visual representation of a stock’s price movement over time. It typically displays the stock’s opening, closing, high, and low prices for each day, week, or month, along with the volume of shares traded. These charts help investors assess past performance and predict potential future movements.
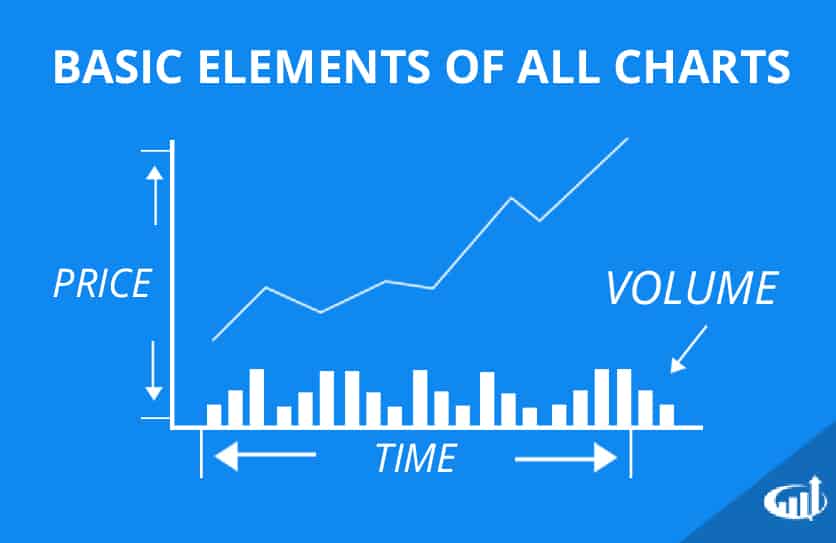
Stock Chart Example
Below is an example of a basic stock chart that highlights common elements such as the price movements and volume bars.
Types of Stock Charts
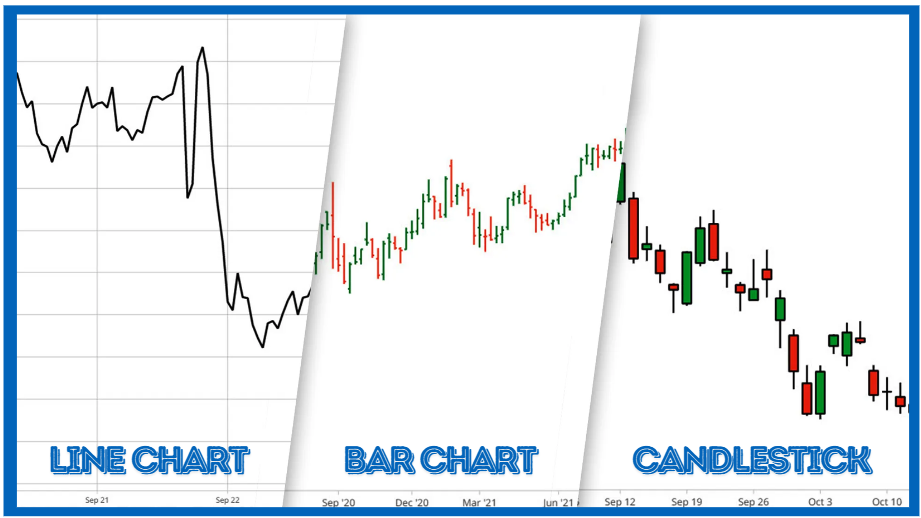
There are several types of stock charts, but the most common ones for beginners are:
- Line Charts:
Show a simple line connecting the closing prices over time. This type of chart is straightforward and ideal for quickly spotting general price trends. - Bar Charts:
Display the opening, closing, high, and low prices as vertical bars. Each bar helps investors see how the stock price fluctuated throughout the day. - Candlestick Charts:
Similar to bar charts, but use “candlestick” shapes to represent price information. These charts provide more detail by showing the opening and closing prices in a visually appealing format. Green or white candles indicate a price increase, while red or black candles show a decrease.
Key Elements of a Stock Chart
- Price Axis: The vertical axis showing the stock’s price range
- Time Axis: The horizontal axis representing the time period, such as days, weeks, or months.
- Volume: Bars at the bottom of the chart that show the number of shares traded during each period. High volume can indicate strong investor interest.
- Trend Lines: Lines drawn to connect price points, helping to identify the overall trend direction. These lines can highlight support and resistance levels or potential breakouts.
Understanding Trends
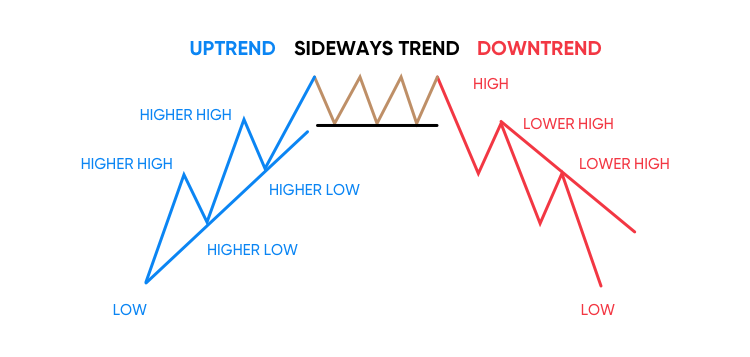
One of the primary uses of stock charts is to identify trends. Recognizing these trends is crucial for making well-timed buy and sell decisions:
- Uptrend: A series of higher highs and higher lows, indicating bullish momentum.
- Downtrend: A series of lower highs and lower lows, showing bearish sentiment.
- Sideways Trend: Price moves horizontally with no clear direction, suggesting consolidation.
Support and Resistance Levels
Support and resistance levels are key price points where a stock tends to stop moving lower (support) or higher (resistance). Understanding these levels can help investors decide where to enter or exit a trade.
Moving Averages
Moving averages are lines on the chart that show the average price over a specific period, smoothing out price fluctuations. The 50-day and 200-day moving averages are among the most commonly used to identify long-term and short-term trends.
- Short-term Moving Average (e.g., 50-day): Helps identify short-term trend directions.
- Long-term Moving Average (e.g., 200-day): Provides insight into longer-term trends.
Chart patterns
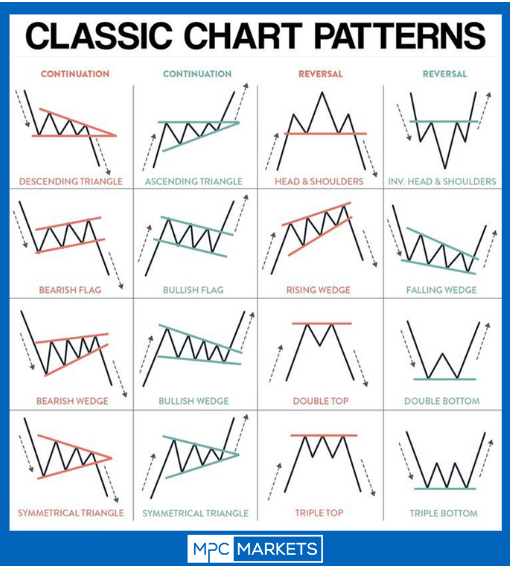
Here’s a brief explanation of each chart pattern from the image:
- Descending Triangle (Continuation): A bearish pattern where the price forms lower highs while finding support at a horizontal level, indicating a potential downward breakout.
- Ascending Triangle (Continuation): A bullish pattern where the price forms higher lows while facing resistance at a horizontal level, suggesting a possible upward breakout.
- Head & Shoulders (Reversal): A bearish reversal pattern where the price forms three peaks, with the middle peak being the highest, signaling a potential trend reversal from bullish to bearish.
- Inverse Head & Shoulders (Reversal): A bullish reversal pattern with three troughs, where the middle trough is the lowest, indicating a shift from a downtrend to an uptrend.
- Bearish Flag (Continuation): A short-term consolidation in a downtrend, where price moves upward within a channel before continuing its downward move.
- Bullish Flag (Continuation): A short-term consolidation in an uptrend, where price moves downward within a channel before resuming its upward move.
- Rising Wedge (Reversal): A bearish reversal pattern where the price consolidates within an upward-sloping wedge, often leading to a breakdown.
- Falling Wedge (Reversal): A bullish reversal pattern where the price consolidates within a downward-sloping wedge, typically leading to an upward breakout.
- Bearish Wedge (Continuation): A bearish continuation pattern where the price consolidates within an upward-sloping wedge before resuming its downward trend.
- Bullish Wedge (Continuation): A bullish continuation pattern where the price consolidates within a downward-sloping wedge before continuing its upward trend.
- Double Top (Reversal): A bearish reversal pattern where the price forms two peaks at roughly the same level, indicating potential for a downtrend after failing to break resistance twice.
- Double Bottom (Reversal): A bullish reversal pattern where the price forms two troughs at similar levels, signaling potential for an uptrend after failing to break support twice.
- Symmetrical Triangle (Continuation – Bearish): A neutral consolidation pattern that can break in either direction but often continues in the direction of the prior trend, in this case downward.
- Symmetrical Triangle (Continuation – Bullish): Similar to its bearish counterpart but typically breaks upward in line with the preceding uptrend.
- Triple Top (Reversal): A bearish reversal pattern where the price forms three peaks at similar levels, indicating strong resistance and potential for a downtrend.
- Triple Bottom (Reversal): A bullish reversal pattern where the price forms three troughs at similar levels, suggesting strong support and potential for an uptrend.
Conclusion
Understanding these basic concepts of stock charts is crucial for any beginner investor. As you become more comfortable with these fundamentals, you can explore more advanced charting techniques and indicators to refine your investment strategy.
Remember, while charts are valuable tools, they should be used in conjunction with other forms of analysis and research when making investment decisions. Investing is about gathering information, developing insights, and using all available resources to make the best possible decisions.
Take the time to practice reading stock charts, and soon they’ll become an invaluable part of your investing toolkit.


