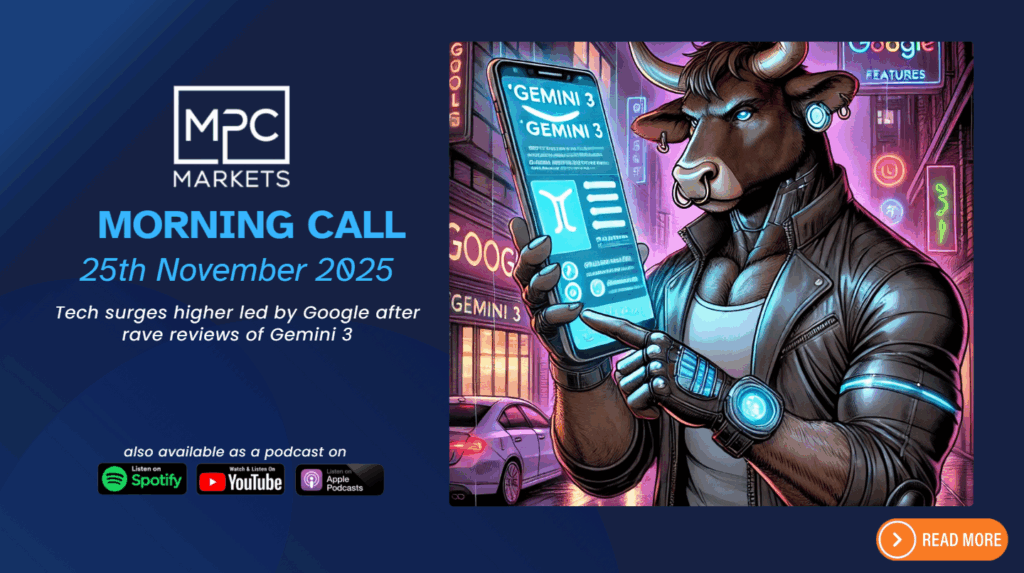
MPC Morning Call 25th November 2025 – Tech surges higher led by Google after rave reviews of Gemini 3
Google led the market higher overnight as enthusiasm on their TPU technology and Gemini 3 re-ignited investors AI enthusiasm

Google led the market higher overnight as enthusiasm on their TPU technology and Gemini 3 re-ignited investors AI enthusiasm
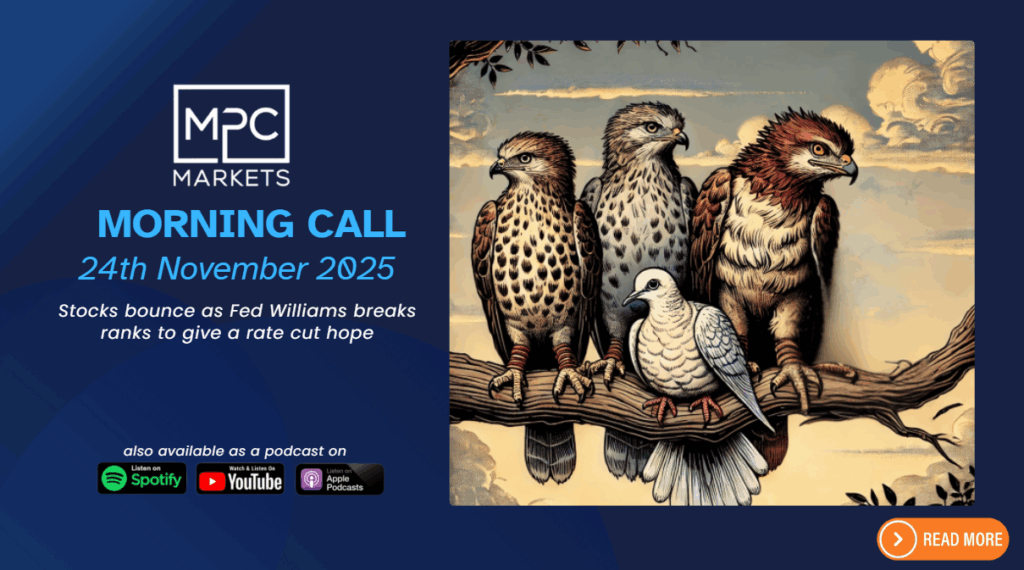
Stocks bounced back on Friday on very thin hopes for a December rate cut, as Fed Williams went against all the recent Fed speak and suggested a cut could come soon.

Nvidia faces increasing scrutiny after trading algorithms uncovered critical accounting red flags in its latest earnings report, highlighting issues beneath the headline growth. Key among these is a sharp rise in accounts receivable, with the company’s Days Sales Outstanding (DSO) spiking to 53 days—well above norms and suggesting customers are taking delivery of chips they can’t pay for, resulting in phantom revenue.
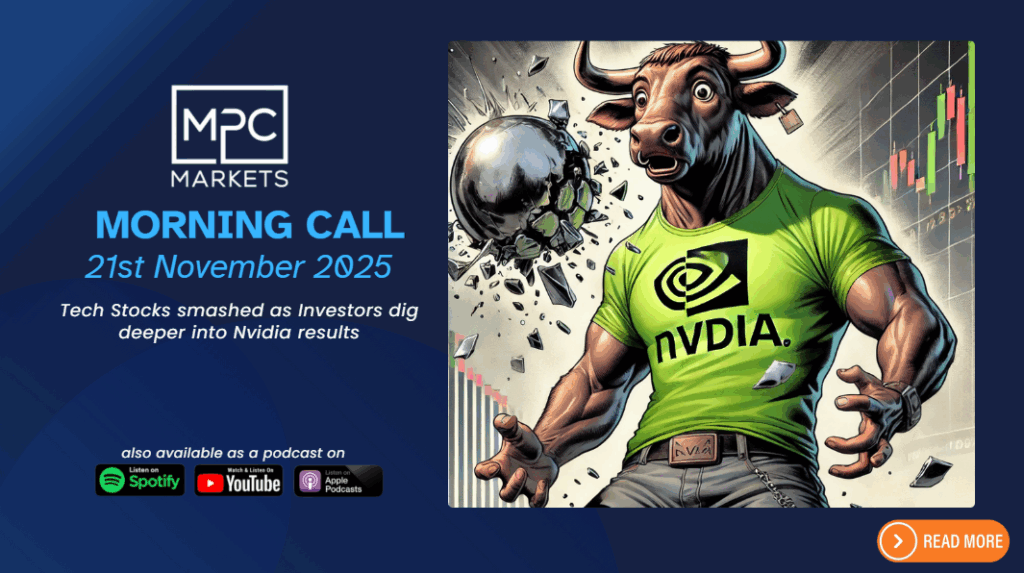
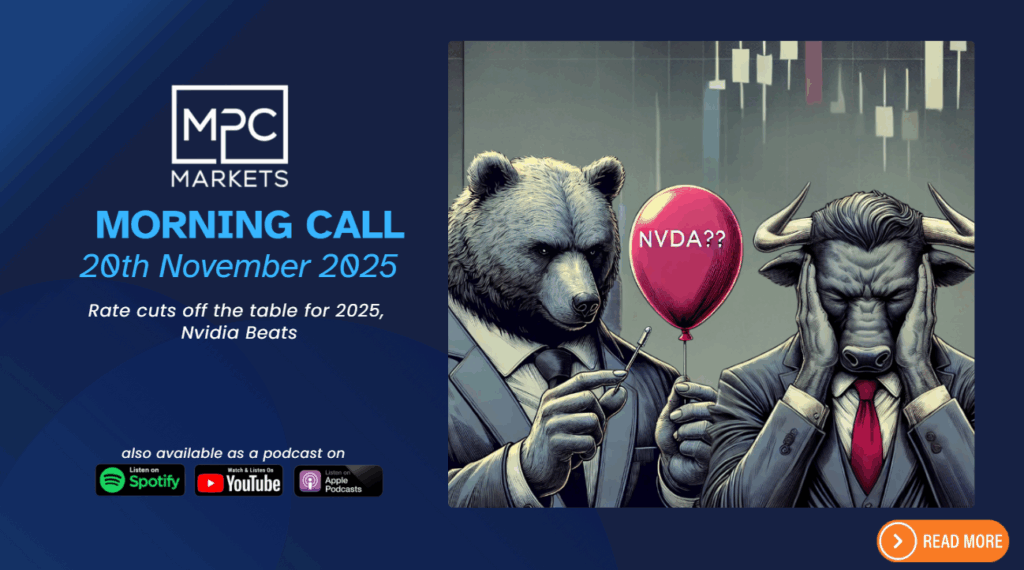
Stocks were smashed overnight as an Nvidia led rout of the AI stocks, as rate cuts were taken off the table due to better than expected Payrolls.
Global markets were steady but cautious this afternoon as investors weighed stretched tech valuations and upcoming US data. The ASX followed suit, trading in a tight range as weakness in local tech offset strength in gold and energy names. Turnover remained light, with traders preferring defensive sectors while awaiting clearer signals on rates and global earnings.
Stocks gave up early gains after the minutes of the Fed’s October meeting cast doubt on a December rate cut, adding to cautious sentiment on risk just ahead of key earnings from bellwether Nvidia.
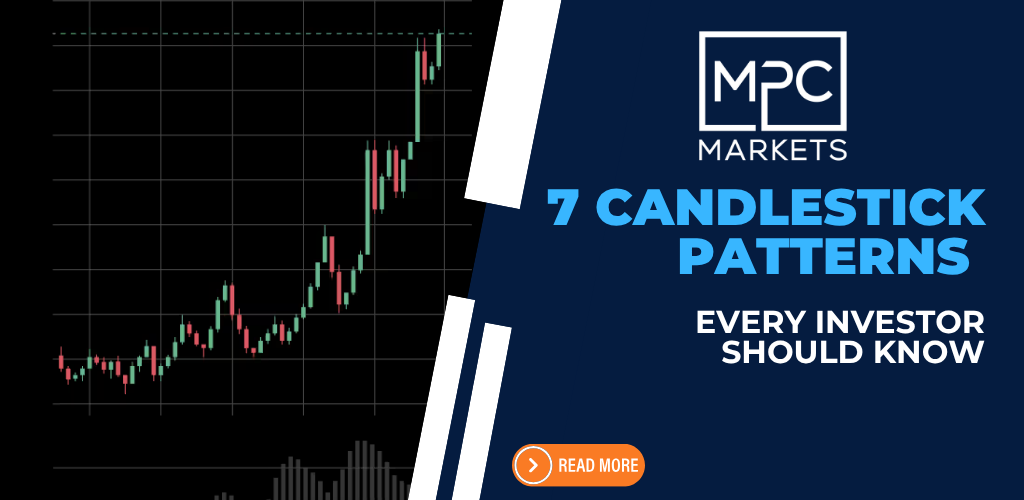
Candlestick charts, invented by Japanese rice trader Munehisa Homma in the 18th century, are a powerful tool for visualizing price movements and market sentiment. Each candlestick shows an asset’s open, high, low, and close prices for a period, revealing the battle between buyers (bulls) and sellers (bears). Green or white candles indicate bullish closes (close > open), while red or black signal bearish ones (close < open). Understanding these patterns can help predict short-term reversals or continuations, but always confirm with other tools like support/resistance or volume.

Tech led stocks, adding to recent losses as the selloff in AI related companies continued just a day ahead of key earnings from Nvidia and a long-awaited labour market reading for September due later this week.
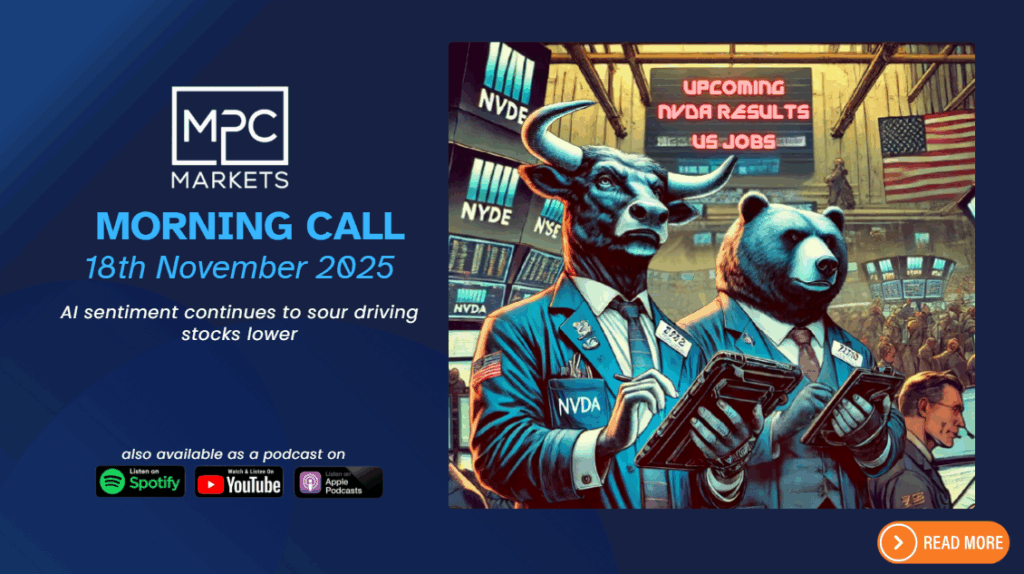
Stocks closed lower overnight as sentiment on the AI trade continued to sour amid growing concerns about valuations, with Nvidia leading the broader to the downside ahead of its quarterly results due later this week.
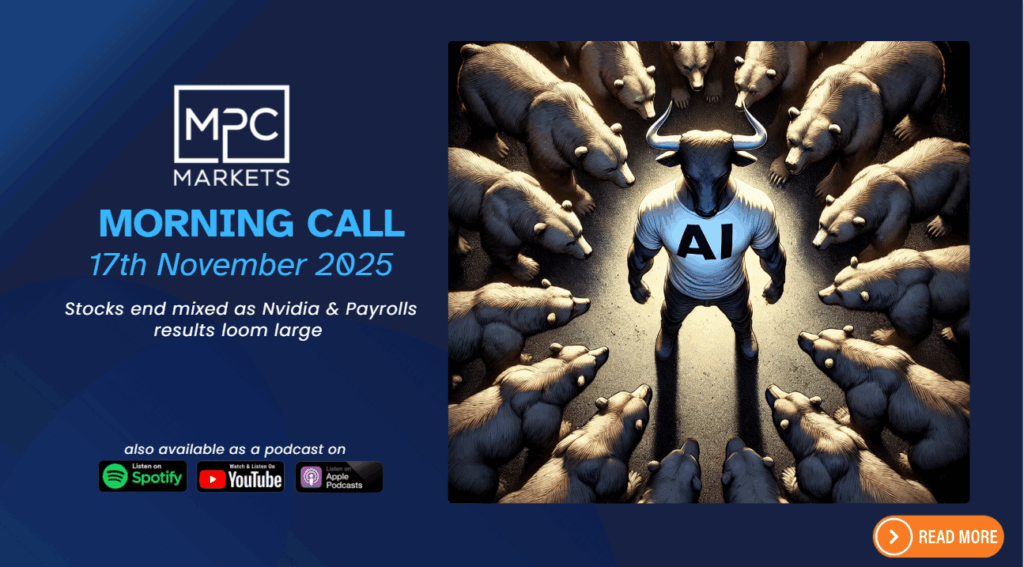
Stocks closed mixed on Friday night, well off the lows of the session as investors bought the dip in AI-related stocks to spark a turnaround in tech and shrugged off concerns about waning odds of a December rate cut.

Tech stocks led the market lower as an ongoing rotation out of big tech and waning odds of a December rate cut weighed on sentiment even with the ending of the longest ever US government shutdown.
The rotation to a more defensive stance continued overnight as investors rotated out of Tech into ahead of the confirmation of a deal to end the longest-ever federal government shutdown.